Pathways to Sustainable European Energy Systems

As indicated above, the two main model approaches used to analyse the electricity supply sector are ELIN and EPOD. The ELIN (ELectricity INvestment) model is a long-term dynamic optimisation model that describes the present generation system, as derived from the Chalmers PP database, and includes an extensive array of new technologies that are to be used to meet the changes in future demand as existing capacity comes of age or becomes unprofitable. The time horizon of the ELIN model is Year 2010 to Year 2050. Each in-between year is separately described. The intra-annual time resolution of the ELIN model is 16 time-steps, including two daily load segments (night load and day load) for weekdays and weekends. Furthermore, this two-variant diurnal weekly load representation is allocated over four different seasons: winter, summer, spring and autumn. Typical model outputs from the ELIN model include capacity and production levels of electricity by fuel and region (or country) until Year 2050, aggregated investment costs, electricity trade between regions (or countries), and marginal costs of electricity. In general, in the model runs, a CO2-emission cap, which is gradually reduced as one nears Year 2050, is imposed on emissions from electricity production. Thus, the marginal cost of CO2-emission reductions is also part of the model output.
The short-term dispatch model EPOD (European Power Dispatch) analyses in detail a specific year based on the capacities (existing and new) obtained in a preceding ELIN model run. Fuel prices and prices of CO2 (marginal costs of CO2 reduction, as obtained using the ELIN model) are also taken from the ELIN model. The dispatch analysis may be conducted weekly, diurnally or hourly. The link between the operation of combined heat and power schemes and the district heating load, as well as cycling properties of power plants are taken into consideration. The typical outputs from an EPOD model run include the production levels of electricity by fuel and region (or country), emissions of CO2, electricity trade between regions (or countries), and marginal costs of electricity in each region. Thus, the outputs are basically the same as those from the ELIN model, which enables comparisons and quality checks. The main differences between the models are the time perspective (years in ELIN and hours in EPOD) and the possibility for detailed descriptions of power plant operation and transmission bottlenecks in EPOD (discussed in the upcoming sections). Therefore, findings from the EPOD analyses concerning the feasibility and efficiency of the system can be fed back into ELIN, so as to improve the design of that model.
The principal linkages between the ELIN and EPOD models are presented in Figure V. Existing and new electricity-generation capacities for a selected year, as modelled by the ELIN model, are used as inputs to the EPOD model, thereby yielding an electricity-generation output that has significantly higher temporal detail than that achievable using the ELIN model. Thus, capacity investments are made considering the development until Year 2050 and for a relatively coarse intra-annual resolution (ELIN), while the production of electricity is studied in more detail for one year at a time and with a very high intra-annual temporal resolution (EPOD).
The output of the EPOD model, e.g. electricity generation by fuel and country for a specific year, may be directly compared to the corresponding output of a preceding ELIN model run. Thereby, important findings from the considerably higher time resolution in EPOD may be fed back into the ELIN model and, thus, improving the performance and applicability of the latter.
Included in the ELIN-EPOD model package are highly detailed wind-power and solar-power availability data for across Europe. The data have primarily been taken from the ERA Interim database made available through the European Centre for Medium-Range Weather Forecasts (ECMWF). Although the data were originally defined for single spatial cells of 200–700 km2 and covering the entire EU-27, they have been aggregated to fit the ELIN-EPOD regional model structure. Both the annual availability (full-load hours) and the production profiles (see Figure VI) for wind and solar power have been implemented on a regional level.
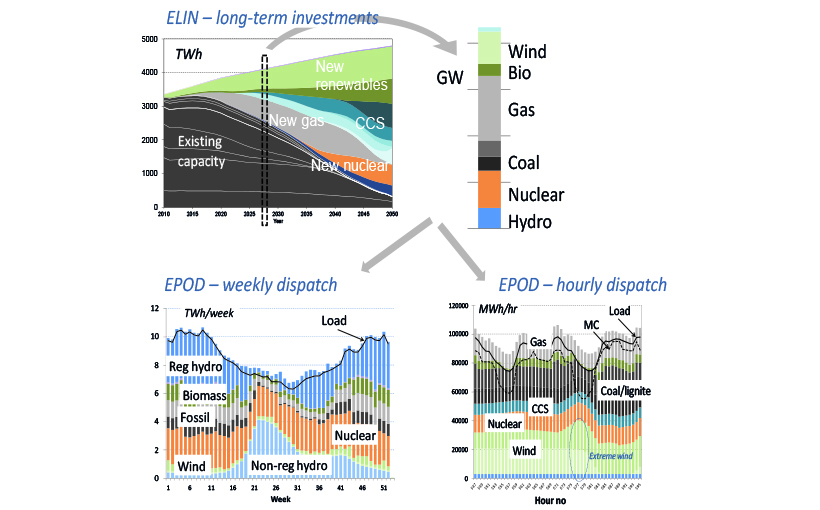
Figure V: Linkages between the ELIN and EPOD models within the electricity-supply system model package. The upper panel shows a typical ELIN model result (aggregated) for the entire EU-27, Norway and Switzerland until 2050. The lower left panel shows a typical EPOD model result for the Nordic countries and for a selected year with weekly resolution. The lower right panel shows an output example for an hourly EPOD model run for the German electricity-supply system around 2030 (assuming, in this case, a postponed nuclear phaseout).
Another feature that is included as an option in the short-term dispatch model EPOD is to assign thermal power plants with cycling properties. Cycling properties include part-load features, such as minimum load requirements, and start and stop decisions. In general, part load implies reduced efficiency, while the start-up phase of a power plant means that fuel must be consumed for several hours, depending on the type of power plant, without generating any income. In both cases, additional costs are incurred and they have an impact on the operation. This is important to consider, especially for electricity systems with a high share of variable renewable electricity production. To include fully the start and stop decisions, one needs to use (mixed) integer programming. However, this is time-consuming, especially if the system is sufficiently large, which is why we have implemented two somewhat simpler linear approaches into the EPOD model, namely, the two-variable approach and the effective generation approach.
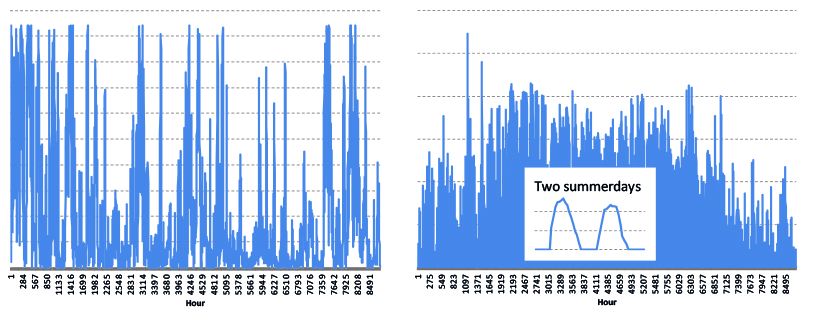
Figure VI: Detailed wind-power (left) and PV-power (right) production profiles in a specific region, as applied within the Pathways research programme (a profile for two days in summer is shown to increase the “visibility” of the PV power profile).
Depending on scope, the ELIN and EPOD models can be set up in either national or regional mode. National mode covers 27 of the EU Member States plus Switzerland and Norway (currently, it excludes the 28th Member State, Croatia). The regional mode covers 53 regions across the EU-27, Switzerland, and Norway (see Figure VII). These regions are defined by major bottlenecks in the European electricity-transmission system and the nomenclature of territorial units for statistics (NUTS)-2 areas. NUTS is used for reporting statistics on a regional level. We use GDP data reported at the NUTS-2 level to estimate electricity demand in each region (i.e. the share of the total national electricity demand allocated to each region within a given country). Thus, running ELIN and EPOD used in regional mode may allow detailed analyses that include also transmission-bottleneck considerations within countries.
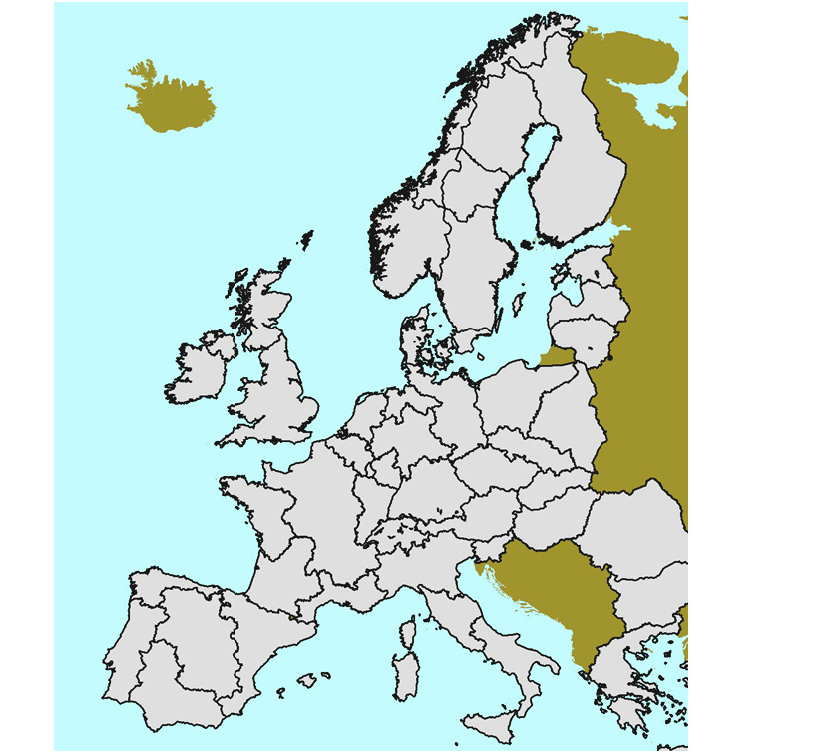
Figure VIII: Regionalisation of the EU-27, Switzerland, and Norway in the ELIN-EPOD model package.
Tightly linked to regionalisation is the option to include load-flow analyses in an EPOD model run. The exchange of electricity between two modelled regions is subject to certain constraints. In its simplest form, the constraint is a thermal limit on capacity or, if available, the Net Transfer Capacity (NTC) value. However, in reality, transmission between two nodes in the transmission system also depends on the generation and load situations at each node. Thus, the transmitted or traded electricity flows through a given interconnector (either between regions or between countries) is a model result that reflects the actual generation and load situations at each end of the interconnector.
As mentioned, the ELIN and EPOD models are tightly linked to each other and together form the main part of the model package used to analyse the European electricity-supply system towards Year 2050. More loosely linked to the ELIN-EPOD package are supplementary models that also have been used in the research process. These models focus on selected issues in greater detail and as a consequence, lack the all-European perspective, which is a feature of the ELIN-EPOD package. Some of the outputs from these supplementary model approaches may, nevertheless, be used as the basis for refining certain boundary conditions, e.g., the performance of selected technologies, in the ELIN-EPOD model package.
One example of a supplementary model is a PV solar model for small-scale applications (e.g., in households), which has been developed during the course of the research. This model investigates the incentives that households encounter to invest in solar PV considering the variations in production and in load and considering the different designs of support schemes. The impacts of load shifting, different pricing models for excess production, and subsides are assessed. The optimisation is performed using a mixed integer optimisation approach. Hitherto, the model has been applied primarily to Swedish conditions.
Another example of a supplementary model is the development of a dispatch-type model that includes the distribution of electricity at different voltages. This model is used to analyse further the linkages between transmission and distribution and the role of decentralised electricity production. So far, this model approach has been used only in relation to the German transmission and distribution grid. Decentralised electricity production is, generally, linked to the distribution grid of the electricity-supply system. When there is an increase in the employment of distributed generation, e.g., solar PV on detached houses, the direction of the power flow may change (historically, the direction has been mostly from higher to lower voltage levels), as may the locations of frequently occurring congestions in the grid. Therefore, it is important to come up with a relevant description of the grid subsystems and include this in the analysis methodology and the electricity-system model package. Included in this specific model approach is the interaction dynamics between transmission and distribution networks, and the load characteristics at different voltage levels, as well as the possibilities and technical limitations associated with connecting distributed generation at different voltage levels in the system. In Figure VIII, the electricity loads at three different voltage levels (low, medium and high) are shown for a German distribution network operator. For the low-voltage grid, typical seasonal variations, with high loads during winter and relatively low loads during summer, are observed. The mid-voltage load lacks the same pronounced seasonal variation but instead includes typical load dips during weekends when industrial activity decreases. For the high-voltage grid, there are no corresponding clear seasonal or intra-weekly patterns to the load variations in this case.
Another purpose of the distribution-grid modelling is to provide feedback to the supply and transmission ELIN-EPOD model package. Thus, while ELIN and EPOD are practically hard-linked to each other, the optional transfer of data between the distribution-grid modelling and ELIN-EPOD is achieved through soft-linking.
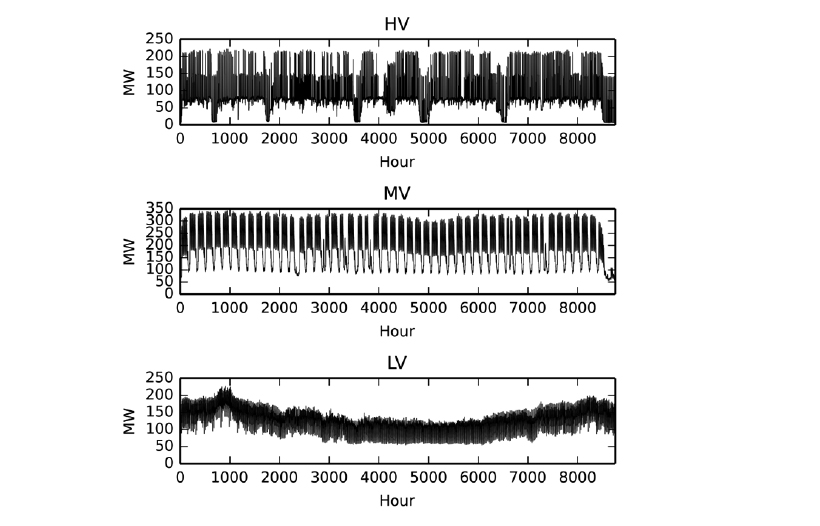
Figure VIII: Load curves for low, medium, and high voltages (LV, MV, and HV, respectively) for 1 year based on data from one German distribution network operator.